Monday, February 25, 2013

The robot economy and the new rentier class | FT Alphaville

The robot economy and the new rentier class

It seems more top-tier economists are coming around to the idea that robots and technology could be having a greater influence on the economy (and this crisis in particular) than previously appreciated. Paul Krugman being the latest.

But first a quick backgrounder on the debate so far (as tracked by us).

Probably the first high-profile advocate of the idea — in recent times — that "technology and computers were changing the economy in weird ways" was Alan Greenspan in the 1990s, when he attributed a mysterious lack of inflation, high productivity and low unemployment rate to the arrival of a technologically rich "New Economy".

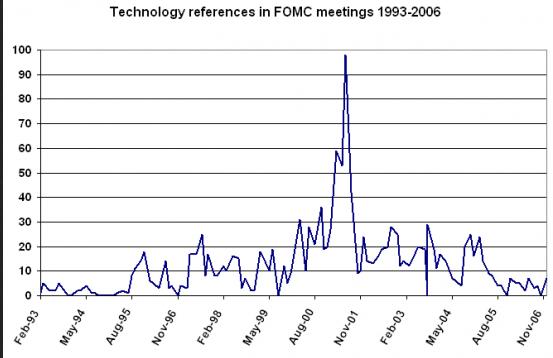
As we've written before, once the tech bubble burst — and Greenspan was supposedly proved so very wrong — the whole idea of technology being a fundamental force in the real economy was abandoned. This is well illustrated by the sudden fall in references to technology in FOMC meetings (as tracked by us):

Apart from a few fringe voices, the technology factor — and its likely effect on the natural unemployment rate as society moves towards a more leisure-focused framework, since all the hard jobs are done by robots and computers — became victim to a deathly silence in the world of serious economic thinking.

Indeed, when we first started considering the idea that technology could be behind the move to zero yields — with the crisis a function of technology shifts than anything else (especially if you follow the Keynesian view that one day a leisure economy becomes inevitable) — there was barely anyone out there to cite on the matter, apart from the Skidelskys and advocates of the Singularity movement.

There has been more commentary since then. George Magnus at UBS, for example, wrote a noteworthy piece in September.

But there has also been commentary to the contrary. Most notably there's the view set out by Robert Gordon (and Peter Thiel) that the crisis was a function of a lack of innovation and technology.

This concept caught the imagination of a lot of people, bringing technology's influence back to the forefront, while also reviving the whole idea of "limits to growth" and us being near that limit point.

Harvard's Ken Rogoff recently debated this point of view with both Thiel and Gordon, but seemed to arrive at a different conclusion. As his op-ed set out last week:

There are certainly those who believe that the wellsprings of science are running dry, and that, when one looks closely, the latest gadgets and ideas driving global commerce are essentially derivative. But the vast majority of my scientist colleagues at top universities seem awfully excited about their projects in nanotechnology, neuroscience, and energy, among other cutting-edge fields. They think they are changing the world at a pace as rapid as we have ever seen. Frankly, when I think of stagnating innovation as an economist, I worry about how overweening monopolies stifle ideas, and how recent changes extending the validity of patents have exacerbated this problem.

We feel this is a hugely important point. For what Rogoff is saying is that if we are experiencing technology stagnation, it's not because humanity has suddenly become less innovative. Rather, it's because incumbent interests now have the biggest incentive ever to impose artificial scarcity, which is stopping the speed of innovation.

Our own personal view is that this is because we've now arrived at a point where technology begins to threaten return on capital, mostly by causing the sort of abundance that depresses prices to the point where many goods have no choice but to become free. This is related to the amount of "free working" hours now being pumped into the economy — the result of crowd sourcing and rising productivity levels — thanks, in part, to the sort of gadgets that allow everyone to work anywhere and anytime, in a work environment that's generally speeding up as everyone tries to keep up with the competition by doing yet more hours voluntarily.

Patent wars, meanwhile… and the rise of companies whose entire raison d'etre is focused on protecting patents… is the ultimate counter force. As a recent Fed paper spelled out, there is real evidence to suggest that idea monopolisation has become a hugely counter-productive force in the economy.

We particularly enjoyed this opinion piece by Steven Levy at Wired Magazine on what he described as the emerging "patent problem".

As he explained:

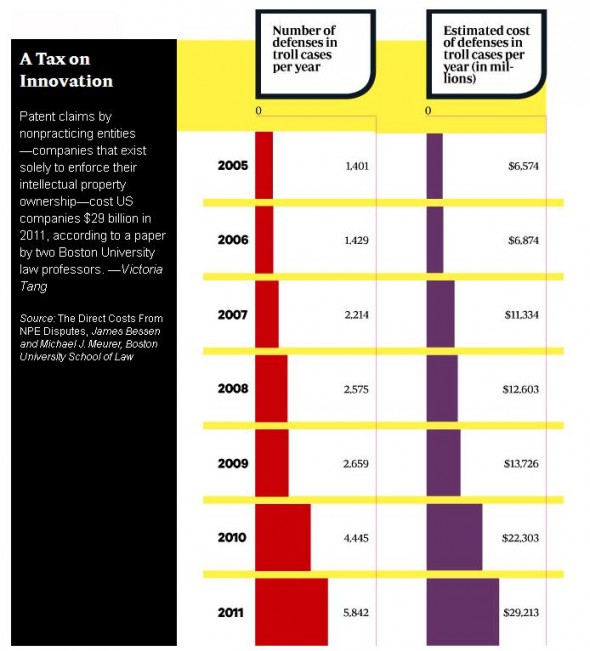
The flaws of the patent system are most vividly exposed by the rise of trolls. The term, inspired by the stunted opportunists of myth, came from an Intel vice president who had been sued for calling a lawyer a "patent extortionist" and needed another expression. It refers to a company that doesn't make products but exists solely on the revenue of its patents. In the parlance of today's patent ecosystem, trolls are known as nonpracticing entities, or NPEs.

The rise of the patent troll effect, meanwhile, is well illustrated by the following Wired graphic:

Which brings us neatly to the latest offering on the technology factor, this time from Paul Krugman — who seems to have spent a large portion of the week thinking about the issue, with no less than two robot-themed postings.

But it's his last one which presents the monopolisation effect best, as he considers what's driving the share of non-farm business sector output downwards so rapidly:

But there's another possible resolution: monopoly power. Barry Lynn and Philip Longman have argued that we're seeing a rapid rise in market concentration and market power. The thing about market power is that it could simultaneously raise the average rents to capital and reduce the return on investment as perceived by corporations, which would now take into account the negative effects of capacity growth on their markups. So a rising-monopoly-power story would be one way to resolve the seeming paradox of rapidly rising profits and low real interest rates.

In our opinion that one paragraph explains today's reality perfectly.

So, robot and technology power is reducing the natural employment rate. But rather than our subsidising those who have lost jobs to technology, so as to spread that manna wealth that's literally dropped onto the surface of the earth at no-one's physical disadvantage, companies are using monopoly power to extort rents on the capital that is creating all that free wealth.

That's why inequality is rising.

As technology proceeds in a patent-obsessed world, the fruits of innovation flow to the owners of the capital and invention, forming a whole new rentier class. The financial assets/debts that back the innovation technology, meanwhile, get disproportionally valuable as their purchasing power gets completely out of whack with the output they radically accelerate.

If you think about it, inequality is always going to be the natural consequence of a technologically-driven deflationary environment. Whereas in inflation, those with financial claims (a.k.a money) are impoverished as their purchasing power is eroded, while those in debt are enriched — in deflation, those with financial claims (the result of increasing rentier flows, if Krugman's point is valid) become enriched as those in debt become increasingly impoverished.

In that sense QE and any move to "debase" financial claims is a move to dilute the wealth effect on legacy claims, which now claim a disproportionate share of available output, at least compared to what they did when they were created.

Low interest rates in many ways are thus only self-correction mechanism bringing the system back to balance — trying to offset the growing power of the innovation-based capital rentier class.

In that context it's understandable that the older the claim, the more preferable it is to hoard it, since the greater its claim over today's output. And in an environment where such claims are self-correcting anyway — via capital destruction brought on by negative rates, as people rush to invest in anything that gives them disproportional access to output and thus crowd each other out — that some of the rentier class see it logical to hoard in non-perishable assets "which cannot be debased" instead is an understandable consequence.

Related links:
Robots! No Robots! – FT Alphaville
Ahhhh! No robots! – FT Alphaville
The Patent Problem – Wired
Whose idea is it anyway – Towards a Leisure Society
Beyond Scarcity – FT Alphaville (series)
Peter Diamandis: Abundance is our future – Ted Talks


Sent from my iPhone

The End of Labor: How to Protect Workers From the Rise of Robots - Atlantic Mobile

The End of Labor: How to Protect Workers From the Rise of Robots

Technology used to make us better at our jobs. Now it's making many of us obsolete, as the share of income going to workers is crashing, all over the world. What do we do now?

615 robot reuters 1.jpg

Reuters

Here's a scene that will be familiar to anyone who's ever taken an introductory economics course. The professor has just finished explaining that in economics, "efficiency" means that there are no possible gains from trade. Then some loudmouth kid in the back raises his hand and asks: "Wait, so if one person has everything, and everyone else has nothing and just dies, is that an 'efficient' outcome?" The professor, looking a little chagrined, responds: "Well, yes, it is." And the whole class rolls their eyes and thinks: Economists.

For most of modern history, inequality has been a manageable problem. The reason is that no matter how unequal things get, most people are born with something valuable: the ability to work, to learn, and to earn money. In economist-ese, people are born with an "endowment of human capital." It's just not possible for one person to have everything, as in the nightmare example in Econ 101.

For most of modern history, two-thirds of the income of most rich nations has gone to pay salaries and wages for people who work, while one-third has gone to pay dividends, capital gains, interest, rent, etc. to the people who own capital. This two-thirds/one-third division was so stable that people began to believe it would last forever. But in the past ten years, something has changed. Labor's share of income has steadily declined, falling by several percentage points since 2000. It now sits at around 60% or lower. The fall of labor income, and the rise of capital income, has contributed to America's growing inequality.

WHERE IS THE MONEY GOING?

What can explain this shift? One hypothesis is: China. The recent entry of China into the global trading system basically doubled the labor force available to multinational companies. When labor becomes more plentiful, the return to labor goes down. In a world flooded with cheap Chinese labor, capital becomes relatively scarce, and its share of income goes up. As China develops, this effect should go away, as China builds up its own capital stock. This is probably already happening.

But there is another, more sinister explanation for the change. In past times, technological change always augmented the abilities of human beings. A worker with a machine saw was much more productive than a worker with a hand saw. The fears of "Luddites," who tried to prevent the spread of technology out of fear of losing their jobs, proved unfounded. But that was then, and this is now. Recent technological advances in the area of computers and automation have begun to do some higher cognitive tasks - think of robots building cars, stocking groceries, doing your taxes.

Once human cognition is replaced, what else have we got? For the ultimate extreme example, imagine a robot that costs $5 to manufacture and can do everything you do, only better. You would be as obsolete as a horse.

Now, humans will never be completely replaced, like horses were. Horses have no property rights or reproductive rights, nor the intelligence to enter into contracts. There will always be something for humans to do for money. But it is quite possible that workers' share of what society produces will continue to go down and down, as our economy becomes more and more capital-intensive. This possibility is increasingly the subject of discussion among economists. Erik Brynjolfsson has written a book about it, and economists like Paul Krugman and Tyler Cowen are talking about it more and more (for those of you who are interested, here is a huge collection of links, courtesy of blogger Izabella Kaminska). In the academic literature, the theory goes by the name of "capital-biased technological change."

The big question is: What do we do if and when our old mechanisms for coping with inequality break down? If the "endowment of human capital" with which people are born gets less and less valuable, we'll get closer and closer to that Econ 101 example of a world in which the capital owners get everything. A society with cheap robot labor would be an incredibly prosperous one, but we will need to find some way for the vast majority of human beings to share in that prosperity, or we risk the kinds of dystopian outcomes that now exist only in science fiction.

REDISTRIBUTION AGAINST THE MACHINE

How do we fairly distribute income and wealth in the age of the robots?

The standard answer is to do more income redistribution through the typical government channels - Earned Income Tax Credit, welfare, etc. That might work as a stopgap, but if things become more severe, we'll run into a lot of political problems if we lean too heavily on those tools. In a world where capital earns most of the income, we will have to get more creative.

First of all, it should be easier for the common people to own their own capital - their own private army of robots. That will mean making "small business owner" a much more common occupation than it is today (some would argue that with the rise of freelancing, this is already happening). Small businesses should be very easy to start, and regulation should continue to favor them. It's a bit odd to think of small businesses as a tool of wealth redistribution, but strange times require strange measures.

Of course, not all businesses can be small businesses. More families would benefit from owning stock in big companies. Right now, America is going in exactly the opposite direction, with companies going private instead of making their stock available for public ownership. All large firms should be given incentives to list publicly. This will definitely mean reforming regulations like Sarbanes-Oxley that make it risky and difficult to go public; it may also mean tax incentives.

And then there are more extreme measures. Everyone is born with an endowment of labor; why not also an endowment of capital? What if, when each citizen turns 18, the government bought him or her a diversified portfolio of equity? Of course, some people would want to sell it immediately, cash out, and party, but this could be prevented with some fairly light paternalism, like temporary "lock-up" provisions. This portfolio of capital ownership would act as an insurance policy for each human worker; if technological improvements reduced the value of that person's labor, he or she would reap compensating benefits through increased dividends and capital gains. This would essentially be like the kind of socialist land reforms proposed in highly unequal Latin American countries, only redistributing stock instead of land.

Now of course this is an extreme measure, for an extreme hypothetical case. It may turn out that the "rise of the robots" ends up augmenting human labor instead of replacing it. It may be that technology never exceeds our mental capacity. It may be that the fall in labor's income share has really been due to the great Chinese Labor Dump, and not to robots after all, and that labor will make a comeback as soon as China catches up to the West.

But if not - if the age of mass human labor is about to permanently end - then we need to think fast. Extreme inequality may be "efficient" in the Econ 101 sense, but in the real world it always leads to disaster.


Sent from my iPhone

Sunday, February 17, 2013

You have received a YouTube video!

http://www.youtube.com/watch?v=86BNs0wSBow&sns=em


Sent from my iPad

You have received a YouTube video!

http://www.youtube.com/watch?v=s3bWrF_GkbQ&sns=em


Sent from my iPad

Minimum Question for Mr. Obama

Minimum Question for Mr. Obama

17 February 2013

Mr. Barack Obama, President
Executive Branch
United States Government
1600 Pennsylvania Ave., NW
Washington, DC

Dear Mr. Obama:

In this year's State of the Union Show you called for the hourly minimum-wage to be raised from $7.25 to $9.00.  That's an increase of more than 24 percent.  Because you trumpet this proposal as one to assist low-paid workers, you, presumably, deny that such a hike in the cost of hiring low-paid workers will prompt employers to hire fewer such workers.

In last year's State of the Union Show you bragged of your administration's increase in the tariff rate on Chinese-made automobile tires.  This tariff increase, which averages 30 percent over three years, is explicitly designed to dissuade Americans from buying Chinese-made tires – an effect that you recognize and applaud.

Question: If a government policy that artificially raises the price of Chinese-made tires reduces the quantities of such tires that are bought, why does a government policy that artificially raises the price of low-skilled labor not reduce the quantities of such labor that are hired?

I'm told that you're a man of science.  I await your response.

Sincerely,
Donald J. Boudreaux
Professor of Economics
and
Martha and Nelson Getchell Chair for the Study of Free Market Capitalism at the Mercatus Center
George Mason University
Fairfax, VA  22030

Add a Comment    Share Share    Print    Email


Sent from my iPhone

Saturday, February 16, 2013

Quartz: How robots are eating the last of America’s—and the world’s—traditional manufacturing jobs

http://qz.com/53710

Baxter, the affordable, humanoid industrial robot recently unveiled by Rethink Robotics, is so easy to program that I once did it one-handed and drunk. We were at a party at the Massachusetts Institute of Technology (MIT), and he was standing in the corner, looking lonely. No, really—Baxter has expressive eyes projected on a touchscreen where [...]


Sent from my iPhone

Monday, February 11, 2013

The Cities Winning The Battle For The Fastest Growing High-Wage Sector In The U.S. | Newgeography.com

THE CITIES WINNING THE BATTLE FOR THE FASTEST GROWING HIGH-WAGE SECTOR IN THE U.S.

iStock_000007524038XSmall.jpg

In an era in which many businesses that pay high wages have been shedding jobs, the wide-ranging employment category of professional, scientific and technical services has been a relatively stellar performer, expanding some 15% since 2001. In contrast, employment dropped over 20% in such lucrative fields as manufacturing and information-related businesses (media, telecom providers, software publishing) over the same period, and finance and wholesale trade experienced small declines.

With an average annual wage nearing $90,000, this category — which includes computer consulting and technical services, accounting, engineering and scientific research, as well as legal, management and marketing services  — increasingly shapes the ability of regions to generate higher-wage jobs. In order to determine which metropolitan areas are doing best, Mark Schill of Praxis Strategy Group compiled rankings based on both long and short-term growth, as well as the extent and growth of each region's business service economy compared to the national average.

Notably absent from the top 10 are Chicago and the big metropolitan areas of the Northeast and California that have traditionally dominated high-end business services. The only exception is the third-ranked San Francisco-Oakland-Fremont metropolitan statistical area, which has logged 21% growth in this sector since 2001, while expanding the proportion of such jobs in the local economy to nearly twice the national average. Over the past year alone the region added 22,000 professional and business services jobs, which was more than a quarter of all new positions during that period.

The continuing vitality of nearby Silicon Valley, and the region's attraction to educated workers, have made the Bay Area easily the best performer of the nation's mega-regions. Yet the other leaders on our list are generally smaller, growing metro areas whose expansions have been propelled by a rapid increase in employment in technology and professional management services. These include our top-ranked metro area, Austin-Round Rock-San Marcos, Texas, which enjoyed over 46% growth in employment in professional services since 2001;  fourth-place Raleigh-Durham, N.C.; and No. 5 Salt Lake City, Utah. These areas have enjoyed strong net-in migration of educated workers, and have poached companies from more expensive regions.

More surprising still has been the rapid ascent of such unheralded regions as second-place Jacksonville, Fla., and Oklahoma City (sixth place). In Oklahoma City, where business and professional services employment has grown over 30% since 2001, progress can be traced to the city's burgeoning energy sector.

But some other areas on our list are benefiting from a hitherto unnoted shift of high-end services to lower-cost and often lower-density regions. Jacksonville may be the poster child for this. Over the past decade, the northern Florida metro area's population has grown 20% to over 1.3 million, but business services employment has expanded nearly 50%, the biggest jump of any of the country's 51 largest metropolitan areas. Once a business services backwater, the share of jobs in that sector in the local economy has rapidly climbed towards the national average. This growth has been driven by management consulting as well as computer and data center services, an area in which Jacksonville has enjoyed among the highest growth rates in the country. One major player is web.com, which employs 500 people at its headquarters in south Jacksonville.

Other industries that rely on professional and business service providers have recently added jobs in the market, including BI-LO and Winn Dixie, which moved their combined headquarters  there, as did environmental services company Advanced Disposal. Financial giant Deutsche Bank has also  expanded in the area.

Jerry Mallot, president of the local business development group Jaxusa Partnership, suggests that low costs, a high rate of housing affordability and Florida's lack of income tax make Jacksonville attractive to companies seeking to expand or relocate. The state, according to a recent report from New Jersey-based www.BizCosts.com, is now home to five of the country's least expensive and most pro-business cities. Jacksonville, Orlando, and Tampa also are all among the U.S. metro areas adding college-educated residents the fastest.

Of course up-and-comers like Jacksonville, Charlotte, and Oklahoma City, and even Portland (10th place), still lack the critical mass of high-end business services of many of the larger, more established metropolitan areas. Some have continued to see strong growth in their professional services sectors. Not surprisingly, this includes greater Washington, D.C. (11th), with 26% growth since 2001, keyed by the expansion of government and the regulatory apparat in recent years. The share of professional services jobs in the local economy is two and a half times the national average, the highest concentration in the country.

Yet many of America's largest metro areas, including longtime business service bastions, have lagged well behind. New York, home to Wall Street and many leading consulting, legal and professional firms, ranks a mediocre 32nd out of the 51 largest metro areas, with relatively meager growth of 8.5%. The share of professional services jobs in the New York economy fell, as it did in Los Angeles-Long Beach-Santa Ana (36th) and Chicago-Joliet-Naperville (43rd). This suggest trouble ahead for the future.

Chicago was among the few areas that actually lost employment in this generally fast-growing field. The other big losers include Detroit-Warren-Livonia, Mich. (39th) , despite a decent  pickup in the last two years as the auto industry has rebounded;  the Cleveland metro area (47th); Milwaukee-Waukesha-West Allis, Wisc. (49th); Birmingham-Hoover, Ala. (50th); and last-place Memphis.

What do these trends tell us about the future of high-wage employment? Certainly size is not enough, nor even the possession of strong legacy in business service industries. The relative declines of our three largest metro areas — New York, Los Angeles and especially Chicago — alone tells us that. Chicago, which has touted itself as a capital of business expertise, now seems to be falling into the nether reaches long inhabited by older Rust Belt cities and Southern backwaters. Chicago leaders such as Mayor Rahm Emanuel needs to spent less time being possessed by what Time Out Chicago called a "world class city complex" and look into why, as urban analyst Aaron Renn suggests, the city's vaunted global economy is not enough to produce enough high-wage jobs to sustain its vast surrounding region.

At the same time, being small and affordable, while helpful, is also not sufficient for business services success, as the presence of a number of smaller metro areas at the bottom of the list suggests. But the strong performance of many mid-sized cities  – ranging from Austin, Raleigh and Salt Lake to less-heralded Jacksonville, Kansas City, Oklahoma City and Richmond — suggest that these jobs will likely continue to migrate to smaller, less costly and generally less dense urban regions.

Once considered the natural domain of megacities and dense urban cores, high-wage business service jobs, largely due to technology, can increasingly be done anywhere. This suggests that the playing field for such positions, rather than concentrating, will become ever wider. As the struggle for good jobs intensifies in the years ahead, expect the competition between regions to get even greater.


Professional, Technical, and Scientific Services in the Nation's Largest Metropolitan Areas
Rank   Index Score 2001 - 2012 Growth 2005 - 2012 Growth 2010 - 2012 Growth 2012 LQ 2001 - 2012 LQ Change 2012 Avg. Annual Wage
1 Austin-Round Rock-San Marcos, TX 79.6 46.9% 38.8% 13.8% 1.43 5.9% $90,649
2 Jacksonville, FL 79.1 50.2% 17.6% 8.4% 0.99 28.6% $72,913
3 San Francisco-Oakland-Fremont, CA 67.2 21.4% 23.6% 12.9% 1.97 11.3% $120,442
4 Raleigh-Cary, NC 63.5 34.5% 26.1% 10.8% 1.40 0.7% $81,025
5 Salt Lake City, UT 63.3 33.4% 26.2% 9.8% 1.10 6.8% $76,341
6 Oklahoma City, OK 59.9 31.1% 16.6% 11.0% 0.89 8.5% $62,374
7 Kansas City, MO-KS 59.5 24.2% 17.6% 10.4% 1.24 10.7% $82,060
8 Richmond, VA 57.7 28.9% 16.9% 8.2% 1.01 9.8% $82,184
9 Charlotte-Gastonia-Rock Hill, NC-SC 56.1 29.9% 24.4% 6.3% 0.97 5.4% $81,171
10 Portland-Vancouver-Hillsboro, OR-WA 55.1 24.6% 17.3% 10.2% 1.05 5.0% $73,601
11 Washington-Arlington-Alexandria, DC-VA-MD-WV 55.1 26.1% 11.7% 3.5% 2.45 1.7% $119,460
12 Riverside-San Bernardino-Ontario, CA 54.6 45.5% 3.1% 2.1% 0.58 11.5% $52,617
13 Nashville-Davidson--Murfreesboro--Franklin, TN 52.8 31.7% 11.3% 5.6% 0.88 7.3% $81,189
14 Buffalo-Niagara Falls, NY 52.4 22.7% 19.4% 5.2% 0.93 10.7% $64,449
15 Atlanta-Sandy Springs-Marietta, GA 52.2 18.6% 14.4% 10.7% 1.30 3.2% $87,575
16 Columbus, OH 51.9 23.4% 17.6% 5.8% 1.16 6.4% $81,027
17 San Diego-Carlsbad-San Marcos, CA 50.9 24.7% 13.4% 3.4% 1.51 5.6% $98,390
18 Sacramento--Arden-Arcade--Roseville, CA 50.3 29.6% 11.0% 1.1% 1.06 10.4% $81,973
19 San Antonio-New Braunfels, TX 48.1 30.5% 13.2% 5.3% 0.80 0.0% $69,979
20 Baltimore-Towson, MD 47.4 20.0% 8.4% 6.1% 1.34 3.9% $93,263
21 Seattle-Tacoma-Bellevue, WA 47.1 18.3% 21.3% 6.6% 1.21 -1.6% $88,345
22 Tampa-St. Petersburg-Clearwater, FL 46.7 18.7% 7.6% 5.0% 1.17 8.3% $72,087
23 Boston-Cambridge-Quincy, MA-NH 44.8 10.5% 15.5% 7.6% 1.62 -1.8% $118,694
24 Dallas-Fort Worth-Arlington, TX 44.6 20.1% 17.1% 5.4% 1.12 -2.6% $89,392
25 Denver-Aurora-Broomfield, CO 44.2 14.3% 16.5% 5.5% 1.44 -1.4% $91,922
26 Las Vegas-Paradise, NV 43.6 33.4% -1.1% 1.6% 0.74 4.2% $74,939
27 Louisville/Jefferson County, KY-IN 41.8 16.4% 13.8% 4.7% 0.82 2.5% $65,664
28 Cincinnati-Middletown, OH-KY-IN 41.3 13.3% 7.6% 7.8% 0.96 1.1% $71,259
29 Orlando-Kissimmee-Sanford, FL 39.9 26.6% 0.0% 3.0% 0.98 -2.0% $72,368
30 Houston-Sugar Land-Baytown, TX 39.0 20.4% 15.0% 4.1% 1.15 -10.2% $101,352
31 New Orleans-Metairie-Kenner, LA 38.8 6.0% 11.8% 2.5% 0.97 10.2% $78,866
32 New York-Northern New Jersey-Long Island, NY-NJ-PA 37.5 8.5% 9.8% 7.1% 1.36 -6.2% $110,211
33 Indianapolis-Carmel, IN 36.2 17.2% 10.6% 1.9% 0.85 -2.3% $76,393
34 San Jose-Sunnyvale-Santa Clara, CA 35.4 -5.5% 13.7% 7.9% 2.10 -9.1% $143,640
35 Pittsburgh, PA 35.0 6.8% 10.0% 6.4% 1.06 -4.5% $81,614
36 Los Angeles-Long Beach-Santa Ana, CA 34.8 7.8% 4.3% 5.6% 1.22 -3.2% $89,157
37 Minneapolis-St. Paul-Bloomington, MN-WI 32.2 4.5% 7.1% 7.8% 1.04 -8.0% $89,476
38 Miami-Fort Lauderdale-Pompano Beach, FL 31.9 10.5% 0.4% 3.5% 1.13 -4.2% $76,567
39 Detroit-Warren-Livonia, MI 31.6 -6.4% -2.1% 10.5% 1.48 -3.3% $87,909
40 Philadelphia-Camden-Wilmington, PA-NJ-DE-MD 30.8 6.0% 1.0% 4.2% 1.27 -5.2% $100,423
41 Rochester, NY 30.3 5.8% 0.7% 6.7% 0.83 -4.6% $65,787
42 Phoenix-Mesa-Glendale, AZ 28.5 12.9% 1.3% 2.4% 0.92 -8.9% $77,201
43 Chicago-Joliet-Naperville, IL-IN-WI 25.6 -2.1% 2.3% 5.8% 1.20 -9.8% $97,746
44 St. Louis, MO-IL 25.5 1.0% 0.9% 4.2% 0.93 -6.1% $77,086
45 Hartford-West Hartford-East Hartford, CT 25.1 2.9% 3.9% 2.5% 0.91 -7.1% $84,846
46 Virginia Beach-Norfolk-Newport News, VA-NC 24.5 7.4% 1.1% -1.3% 0.89 -4.3% $71,609
47 Cleveland-Elyria-Mentor, OH 19.9 -6.5% -3.3% 5.0% 0.92 -8.0% $75,584
48 Providence-New Bedford-Fall River, RI-MA 19.8 4.4% -3.3% -2.2% 0.72 -4.0% $68,834
49 Milwaukee-Waukesha-West Allis, WI 15.8 -5.0% -5.1% 2.3% 0.81 -10.0% $76,264
50 Birmingham-Hoover, AL 4.2 -9.2% -7.8% -2.8% 0.84 -17.6% $75,561
51 Memphis, TN-MS-AR 2.2 -8.2% -11.6% -2.2% 0.52 -17.5% $63,943


Analysis by Mark Schill, Praxis Strategy Group
Data Source: EMSI 2012.4 Class of Worker - QCEW Employees, Non-QCEW Employees & Self-Employed 

The LQ (location quotient) figure in the table above is the local share of jobs that are professional, technical, and scientific services (PSVS) divided by the national share of jobs that are PSVS. A concentration of 1.0 indicates that a region has the same concentration of PSVS as the nation.

Joel Kotkin is executive editor of NewGeography.com and a distinguished presidential fellow in urban futures at Chapman University, and a member of the editorial board of the Orange County Register . He is author of The City: A Global History and The Next Hundred Million: America in 2050. His most recent study, The Rise of Postfamilialism, has been widely discussed and distributed internationally. He lives in Los Angeles, CA.

This piece originally appeared at Forbes.com.


Sent from my iPad

Saturday, February 9, 2013

Bret Swanson – Maximum Entropy » Blog Archive » Zero GDP Reading Exposes the Real Deficit – Economic Growth

Zero GDP Reading Exposes the Real Deficit – Economic Growth

February 1st, 2013

It is currently in fashion to say, with great contrarian flair, that federal spending growth is the slowest since the Eisenhower Administration. Or, as someone famous recently put it, "We don't have a spending problem."

This assertion is, to put it mildly, debatable. Spending jumped 18% in just one year during the Panic of 2008-09. If the government keeps spending at that level, but starts counting after the jump, then the growth rate will appear modest. Spending as a share of GDP is higher than at anytime since World War II, and so is the debt-to-GDP ratio. As the OMB chart below shows, it gets much worse.

Nevertheless, does anyone disagree that we have a growth problem, and a serious one? Yesterday's negative GDP estimate for the fourth quarter of 2012 (-0.1%) should jolt the nation.

Let's stipulate the GDP reading's anomalies — lower than expected inventories and defense spending, which could reverse and add a bit to future growth. Yet economists had expected fourth quarter growth of 1.1% — itself an abysmal projection — and actual growth for the entire year was a barely mediocre 2.2%. Consider, too, that lots of economic activity was moved forward into 2012 to beat the Fiscal Cliff taxman. And don't forget the Federal Reserve's extraordinary QE programs, which are supposed to boost growth.

Whatever we're doing, it's not working. Not nearly well enough to create jobs. And not nearly well enough to help the budget. Because whatever you think about spending or taxes, the key factor in the health of the budget is economic growth.

OMB projects spending will grow (from today's historically high level) around 2.96% per year through 2050. It projects annual economic growth over the period of 2.5%. That gets us a debt crisis somewhere down the line, and lots of other economic and social problems along the way.

Last year, however, keep in mind, growth was just 2.2%, following 2011's even worse reading of 1.8%. If we can't even match the modest 2.5% long-term projection coming out of a severe downturn, our problems may be worse than we think. Economist Robert Gordon of Northwestern asks "Is U.S. Growth Over?" Outlining seven economic headwinds, he projects growth of around 1.5% over the next few decades. In the chart below, you can see what a budget disaster such a slowdown would produce. Deficits quickly grow from a trillion dollars a year today into the many trillions per year.

Perhaps, many are now suggesting, we can tax our way out of the problem. Almost all academic research, however, suggests higher taxes (in terms of rates and as a portion of the economy) hurt economic growth. The Tax Foundation, for example, surveyed the 26 major studies on the topic going back to the early 1980s. Twenty-three of the studies found that taxes hurt economic growth. No study found higher taxes helped growth. Recent experience in Europe tends to confirm these findings.

Today, most of the policy discussion revolves around debt ceilings, sequesters, and the (fading) possibility of grand bargain budget deal. Mostly lost in the equation is economic growth. One question should dominate the thinking of policymakers: What policies would encourage more productive economic activity?

The new possibility of a breakthrough on immigration reform is an encouraging example. A more rational immigration policy for both low-skilled and high-skilled workers could boost economic growth significantly. Can we find more such policies? As you can see in the chart below, higher taxes can't make up the budget shortfall. Faster growth and modest spending restraint can. This chart once again shows the OMB projected spending path (solid black line). The solid blue line shows what would happen to tax receipts if (1) growth remains mediocre and (2) we somehow find a way to dramatically raise the portion of the economy Washington taxes from the historical 18% to 23%.

That's a major jump in taxation. Yet it doesn't get us close to a healthy budget.

Faster growth and modest spending restraint, on the other hand, close the budget gap. And they do so without increasing the share Washington historically takes from the economy. The orange dashed line shows tax receipts under an economy growing at 3.5% with the historic 18% tax-to-GDP ratio. (Growth of 3.5% may sound like an ambitious goal. Keep in mind, however, that we are still far below trend — we've never really recovered from the Great Recession. Long term growth of 3.5%, therefore, merely includes a more rapid recovery to trend over the next several years and then a resumption of the long-term average of 3%.) In the medium to long term, a faster growth-lower tax regime generates more tax revenue than a slow growth-high tax regime.

Faster growth alone would be enough to stabilize budget deficits at today's levels. But that is not enough. Trillion dollar deficits and Washington spending an ever rising share of the economy are not acceptable. Look, however, at the very modest spending restraint that would be required to essentially balance the budget by 2050. If we slowed spending growth from the projected 2.96% annual rate to just 2.7%, we could close the gap.

Does anyone think spending growth of 2.7% per year versus 2.96% is going to tear apart Social Security, Medicare, the military, or other essential government functions. Many of us could imagine responsible ways to reduce projected spending far, far more than that. All this shows is that a little restraint and robust economic growth go a long way.

The slow growth-high tax scenario produces a budget deficit of almost $3.5 trillion in 2050. Under the faster growth-lower tax scenario, with a touch of spending restraint, the 2050 budget deficit would be just $58 billion.

Now, I'm not pretending I know that a higher tax-to-GDP ratio will produce a particular rate of economic growth. The above are just rough scenarios. Lots of factors are in play. And that is precisely the point. Given an complex, uncertain world, we should attempt to align all our policies for economic growth. We know what policies tend to encourage growth, and those that tend to stunt it.

That means getting immigration policy right — and it appears we may finally be getting somewhere. It means smart, reasonable regulatory policies in energy, health care, education, communications, and intellectual property. It means a healthy division of powers between the federal and state governments. And, yes, it means sweeping tax reform — both individual and corporate.

What we are doing today isn't working. We are on a dangerous path. Two percent growth won't get us anywhere. No matter how much we tax ourselves. Only robust growth fueled by entrepreneurship and investment, with a healthy faith in the unknown possibilities of America's future, will get us there.

Tags: , , , ,

This entry was posted on Friday, February 1st, 2013 at 5:26 pm and is filed under Uncategorized. You can follow any responses to this entry through the RSS 2.0 feed. You can leave a response, or trackback from your own site.


Sent from my iPhone

Calafia Beach Pundit: Why Fed policy is hurting the economy

Why Fed policy is hurting the economy

In other words, while everyone, including the Fed, thinks that ultra low interest rates provide an important source of stimulus to the economy, it's quite likely that they do just the opposite. The Law of Unintended Consequences strikes yet again!


The above chart uses the same data as Taylor's original chart, but includes data going back to 1960 (his only went back to 1990). The interpretation of the chart remains the same. There is a strong inverse relationship between fixed investment as a share of GDP (fixed investment includes private residential and nonresidential construction, and private investment in equipment and software) and the unemployment rate, which is a good proxy for the health of the economy. He is careful to note that while the correlation is strong, we cannot infer the direction of causality. But this does illustrate how a lack of investment could go a long way to explaining why the recovery has been so weak. 


It then occurred to me to put his two ideas together, to see if the Fed's monetary policy was correlated with the amount of fixed investment. Where Taylor's WSJ article focuses on how artificially low interest rates limit lending and therefore aggregate demand, and his chart compares fixed investment to the unemployment rate, I wanted to see if there was a link between Fed policy and fixed investment.


As the chart above shows, Fed policy is indeed highly correlated to fixed investment (even more so than the unemployment rate is). This fits hand and glove with the first chart, which links fixed investment to the unemployment rate. The red line in the above chart is the real Federal funds rate (using the Core PCE deflator), since that is a good proxy for the degree to which monetary policy is "tight" or "easy."

This puts some meat on the bones of Taylor's WSJ article. The Fed's unusually accommodative monetary policy stance, which promises extremely low interest rates (negative in real terms) for a long time to come, does appear to be a factor in limiting the amount of funds available for investment, and in reducing aggregate demand, and that in turn helps to explain why the recovery has been so weak.

How else to explain the fact that fixed investment is almost always very strong when monetary policy is very tight, and weak when monetary policy is easy? How else to explain how a decade of extremely low interest rates have failed to stimulate Japan's economy?

Food for thought and controversy...


Sent from my iPad

Friday, February 8, 2013

Hospital Report Cites ‘Appalling’ Suffering in Staffordshire - NYTimes.com

English Hospital Report Cites 'Appalling' Suffering

LONDON — Shockingly bad care and inhumane treatment at a hospital in the Midlands led to hundreds of unnecessary deaths and stripped countless patients of their dignity and self-respect, according to a scathing report published on Wednesday.

The report, which examined conditions at Stafford Hospital in Staffordshire over a 50-month period between 2005 and 2009, cites example after example of horrific treatment: patients left unbathed and lying in their own urine and excrement; patients left so thirsty that they drank water from vases; patients denied medication, pain relief and food by callous and overworked staff members; patients who contracted infections due to filthy conditions; and patients sent home to die after being given the wrong diagnoses.

"This is the story of the appalling and unnecessary suffering of hundreds of people," Robert Francis, the lawyer appointed by the government to lead the inquiry, said at a news conference.

"They were failed by a system which ignored the warning signs and put corporate interests and cost control ahead of patients and their safety," he added. "There was a lack of care, compassion, humanity and leadership. The most basic standards of care were not observed, and fundamental rights to dignity were not respected."

The report into what has been called the biggest scandal in the modern history of the health service found that many of the problems were due to the efforts of the hospital to meet health-service targets, like providing care within four hours to patients arriving at the emergency room. It also said that in its efforts to balance its books and save $16 million in 2006 and 2007 in order to achieve so-called foundation-trust status, which made it semi-independent of control by the central government, the hospital laid off too many people and focused relentlessly on external objectives rather than patient care.

Speaking in the House of Commons, Prime Minister David Cameron apologized for the way the system had allowed "horrific abuse to go unchecked and unchallenged" for so long. So deeply rooted was the trouble, he said, that "we cannot say with confidence that failings of care are limited to one hospital."

Mr. Cameron said that he planned to create a new post, chief inspector of hospitals, beginning in the fall. And he said that he would ask the regulatory bodies in charge of doctors and nurses to explain why no one had had their medical licenses revoked as a result of the scandal.

Since the failings at the hospital first came to light, many of the executives in charge of the hospital and the regional health care body that ran it have left their jobs. But the top official in the region at the time, Sir David Nicholson, is now chief executive of the National Health Service in England, and patients' rights campaigners have called for him to resign.

"We are not scapegoating anybody, but the man at the top of the N.H.S. has not got the leadership skills to take this report forward," said Julie Bailey, who founded the advocacy group Cure the N.H.S. when her mother, Bella, died at Stafford Hospital.

The scandal came to light in 2007, when the Healthcare Commission, the body then charged with overseeing care at the National Health Service, became concerned about unusually high mortality rates at Stafford Hospital. The report on Wednesday is one of several into what went wrong there, and the first to result from a public inquiry.

The report made nearly 300 recommendations, designed, Mr. Francis said, to change the culture at the health service to put patients' needs first. These include prosecuting hospital executives who mislead or withhold information from the public or regulators about events that have harmed patients; prosecuting health care providers for "noncompliance with a fundamental standard leading to death or serious harm of a patient"; ensuring better regulation of health care workers; and relentlessly focusing on fundamental standards of care.

Families of patients who were mistreated at the hospital said that they hoped the report would prevent a repeat of what happened to them.

"We don't want other people suffering like our family did," Christine Dalziel, whose 64-year-old husband, George, died after a bowel cancer operation at Stafford in 2007, told reporters.

Though the operation was successful, Mr. Dalziel went for days without pain medication after his epidural was dislodged, she said, and was left in bed in soiled sheets and lost nearly 60 pounds before dying in the hospital. "His bones were sticking out of his back," she said.


Sent from my iPhone

Thursday, February 7, 2013

Robot Makers Spread Global Gospel of Automation - NYTimes.com

Robot Makers Spread Global Gospel of Automation

CHICAGO — The robot equipment industry has one word for the alarmist articles and television news programs that predict a robot is about to steal your job: Fiddlesticks!

Well, that wasn't actually the word used this week at the Automate 2013 trade show held here through Thursday, but the sentiment was the same. During a presentation on Monday, Henrik I. Christensen, the Kuka Chair of Robotics at Georgia Institute of Technology's College of Computing, sharply criticized a recent "60 Minutes" report on automation that was based on the work of the M.I.T. economists Andrew McAfee and Erik Brynjolfsson.

The two economists in 2011 wrote "Race Against the Machine," a book that renewed the debate about the relationship between the pace of automation and job growth. They argue that the pace of automation is accelerating and that robotics is pushing into new areas of the work force like white-collar jobs that were previously believed to be beyond the scope of computers.

During his talk, Dr. Christensen said that the evidence indicated that the opposite was true. While automation may transform the work force and eliminate certain jobs, it also creates new kinds of jobs that are generally better paying and that require higher-skilled workers.

"We see today that the U.S. is still the biggest manufacturing country in terms of dollar value," Dr. Christensen said. "It's also important to remember that manufacturing produces more jobs in associated areas than anything else."

An official of the International Federation of Robotics acknowledged that the automation debate had sprung back to life in the United States, but he said that America was alone in its anxiety over robots and automation.

"This is not happening in either Europe or Japan," said Andreas Bauer, chairman of the federation's industrial robot suppliers group and an executive at Kuka Robotics, a German robot maker.

To buttress its claim that automation is not a job killer but instead a way for the United States to compete against increasingly advanced foreign competitors, the industry group reported findings on Tuesday that it said it would publish in February. The federation said the industry would directly and indirectly create from 1.9 million to 3.5 million jobs globally by 2020.

The federation held a news media event at which two chief executives of small American manufacturers described how they had been able to both increase employment and compete against foreign companies by relying heavily on automation and robots.

"Automation has allowed us to compete on a global basis. It has absolutely created jobs in southwest Michigan," said Matt Tyler, chief executive of Vickers Engineering, an auto parts supplier. "Had it not been for automation, we would not have beat our Japanese competitor; we would not have beat our Chinese competitor; we would not have beat our Mexican competitor. It's a fact."

Also making the case was Drew Greenblatt, the widely quoted president and owner of Marlin Steel, a Baltimore manufacturer of steel products that has managed to expand and add jobs by deploying robots and other machines to increase worker productivity.

"In December, we won a job from a Chicago company that for over a decade has bought from China," he said. "It's a sheet-metal bracket; 160,000 sheet-metal brackets, year in, year out. They were made in China, now they're made in Baltimore, using steel from a plant in Indiana and the robot was made in Connecticut."

A German robotics engineer argued that automation was essential to preserve jobs and also vital to make it possible for national economies to support social programs.

"Countries that have high productivity can afford to have a good social system and a good health system," said Alexander Verl, head of the Fraunhofer Institute for Manufacturing Engineering in Germany. "You see that to some extent in Germany or in Sweden. These are countries that are highly automated but at the same time they spend money on elderly care and the health system."

In the report presented Tuesday by the federation, the United States lags Germany, South Korea and Japan in the density of manufacturing robots employed (measured as the number of robots per 10,000 human workers). South Korea, in particular, sharply increased its robot-to-worker ratio in the last three years and Germany has twice the robot density as the United States, according to a presentation made by John Dulchinos, a board member of the Robot Industries Association and the chief executive of Adept Technology, a Pleasanton, Calif., maker of robots.

The report indicates that although China and Brazil are increasing the number of robots in their factories, they still trail the advanced manufacturing countries.

Mr. Dulchinos said that the United States had only itself to blame for the decline of its manufacturing sector in the last decade.

"I can tell you that in the late 1990s my company's biggest segment was the cellular phone market," he said. "Almost overnight that industry went away, in part because we didn't do as good a job as was required to make that industry competitive."

He said that if American robots had been more advanced it would have been possible for those companies to maintain the lowest cost of production in the United States.

"They got all packed up and shipped to China," Mr. Dulchinos said. "And so you fast-forward to today and there are over a billion cellphones produced a year and not a single one is produced in the United States."

Yet, in the face of growing anxiety about the effects of automation on the economy, there were a number of bright spots. The industry is now generating $25 billion in annual revenue. The federation expects 1.6 million robots to be produced each year by 2015.

Mr. Greenblatt said that one of the advantages of robots was they did not take breaks.

"My robots are going to work during the Super Bowl," he said. "Do you know how popular I would be to ask my employees to work during the Super Bowl?"


Sent from my iPhone

Cantor Speech Aims to Refocus GOP on Middle-Class Stagnation | TIME.com

The Most Important Chart in American Politics

MedianIncomeNDNChart

There is a single chart — three colored lines on a grid — that shapes the political reality of this country. During the 2012 campaign, one of President Obama's senior strategists called it "the North Star" and started his internal PowerPoint presentations with it. When Republican majority leader Eric Cantor speaks on Tuesday about his vision for the future of the Republican Party, the chart's central message will bind together his words.

The chart tracks three economic trends in the U.S. over the last two decades, between 1992 and 2009. The first two lines — productivity and per capita gross domestic product — are rising. This is the unmistakable American success story, the one reflected in record corporate profits, growing wealth accumulation and the unmatched efficiency of this country's economy. The third line tracks median household income, as measured by the U.S. Census. It shows the story of frustration and stagnation that so many Americans long ago accepted as a reality.

Shortly after 2000, the lines diverged. The economy hummed along, but many Americans, the ones politicians typically refer to as the middle class, stopped feeling the benefits. There are many reasons for the change, and some of them are open to economic debate. (The Congressional Research Service issued a paper [PDF] on the divergence in 2006 so that politicians could make sense of it.) Part of the shift can be attributed to increased income inequality owing to globalization and new technology — the wealthy becoming much wealthier, while the rest stayed the same. Part of it can be attributed to increased corporate profits, as new markets opened overseas and new technology lowered costs. Some of it has to do with how the figures are calculated. But the most important political takeaway of the chart is that at the turn of a new century, much of the U.S. stopped feeling the benefits of a growing national economy.

The chart (above) was originally created by NDN and the New Policy Institute, and it helped Democrats change the way they talked about the frustration of the American people. Shortly after the 2010 election, Simon Rosenberg, who runs those left-leaning think tanks, showed the chart to David Axelrod and David Simas, two of Obama's top political advisers. The point of his presentation was that the emergency of the first two years of the Obama presidency — the Great Recession, brought on by financial collapse — did not explain the economic suffering and resulting anger felt by so many voters. Instead it was a more recent manifestation of a trend that had begun nearly a decade earlier.

"The reason this is happening is because of rising global competition, the defining new economic challenge of our time," Rosenberg said in a recent interview with TIME. "In the actual experience of the American economy, there has become an enormous gap between the upper one-third and everyone else."

Simas led the opinion-research effort for the 2012 Obama campaign, and he told me after the election that the chart hung in his Chicago office, along with a caption he derived from a focus-group participant: "I'm working harder and falling behind." (That same line became a fixture of the President's stump speech.) The Obama campaign built its strategy to attack Mitt Romney by focusing on the flat red line of median household income. Romney struggled to focus the country's attention on the suffering and was never able to escape the Obama campaign's characterization of him as the candidate who didn't understand. By the end of the campaign, Romney became the candidate who understood GDP and productivity, a corporate turnaround artist out of touch with reality. As polls showed, Obama was the one who better understood the struggles of the middle class.

This is why Cantor's speech on Tuesday is worth watching. It will be a full-throated effort to reclaim the median-household-income line for the Republican Party. He will mention the stagnation. He will describe Republican solutions aimed at addressing decade-old frustrations: new federal help for paying for school, tax code simplification and a renewed focus on R&D investment. His rhetoric will strongly echo Obama's campaign stump speech. "Lately it has become all too common in our country to hear parents fear whether their children will indeed have it better than they," Cantor will say, according to early excerpts of his speech. "Our goal: to ensure every American has a fair shot at earning their success and achieving their dreams."

For much of the 2012 campaign, Republicans contented themselves with a message focused on decreased federal spending and debt, two policies that addressed the aftermath of the Great Recession but offered no solutions to the economic struggles that had begun a decade earlier. With Cantor's speech, there is the beginnings of a shift. Like Obama after the 2010 election, Republicans are now directly addressing the fears and frustrations that have been at the heart of each federal election since 2006, a feeling of the country in decline as manifested by stagnant take-home pay. If the 2012 election has any lasting import, it is that fiscally conservative austerity politics alone will not win the day. It must be paired with a broader message. The most important chart in American politics can no longer be ignored.


Sent from my iPad

Wednesday, February 6, 2013

No Flying Cars, but the Future Is Bright - Bloomberg

No Flying Cars, but the Future Is Bright

It has been 40 years since the last astronauts left the moon. That anniversary, which passed last week, has put some prominent technologists in a funk.

"You promised me Mars colonies. Instead, I got Facebook," reads the cover of the current issue of MIT Technology Review. In an essay titled "Why We Can't Solve Big Problems," editor Jason Pontin considers "why there are no disruptive innovations" today.

Technology Review's headline, running below the face of Apollo astronaut Buzz Aldrin, now 82, is a play on another slogan: "We wanted flying cars. Instead we got 140 characters." That one comes from the manifesto of Founders Fund, a Silicon Valley venture-capital firm started by PayPal founders Peter Thiel, Luke Nosek and Ken Howery to invest in "transformational technologies and companies." (Among their investments is Space X, the launch-system business founded by Elon Musk.)

In speeches, interviews and articles, Thiel decries what he sees as the country's lack of significant innovations. "When tracked against the admittedly lofty hopes of the 1950s and 1960s, technological progress has fallen short in many domains," he wrote last year in National Review. "Consider the most literal instance of non­acceleration: We are no longer moving faster."

Such warnings serve a useful purpose. Political barriers have in fact made it harder to innovate with atoms than with bits. New technologies as diverse as hydraulic fracturing and direct-to-consumer genetic testing (neither mentioned by Thiel) attract instant and predictable opposition. As Thiel writes, "Progress is neither automatic nor mechanistic; it is rare."

Vivid Visions

But the current funk says less about economic or technological reality than it does about the power of a certain 20th-century technological glamour: all those images of space flight, elevated highways and flying cars, with their promise of escape from mundane existence into a better, more exciting place called The Future. These visions imprinted themselves so vividly on the public's consciousness that they left some of the smartest, most technologically savvy denizens of the 21st century blind to much of the progress we actually enjoy.

"The future that people in the 1960s hoped to see is still the future we're waiting for today, half a century later," writes Founders Fund partner Bruce Gibney in the firm's manifesto. "Instead of Captain Kirk and the USS Enterprise, we got the Priceline Negotiator and a cheap flight to Cabo."

He forgets just how exotic airplane travel was for the typical TV viewer in 1966, when "Star Trek" debuted. Today's cheap and easily booked flights let a lot more people fly. That means the average speed at which someone travels over a lifetime can increase even if, as Thiel laments, the fastest vehicle on the planet is no faster than it was decades ago. Making an impressive technology widely available isn't as glamorous as pushing the technological frontier, but it represents significant, real-life progress.

The world we live in would be wondrous to mid-20th-century Americans. It just isn't wondrous to us. One reason is that we long ago ceased to notice some of the most unexpected innovations.

Forget the big, obvious things like Internet search, GPS, smartphones or molecularly targeted cancer treatments. Compared with the real 21st century, old projections of The Future offered a paucity of fundamentally new technologies. They included no laparoscopic surgery or effective acne treatments or ADHD medications or Lasik or lithotripsy -- to name just a few medical advances that don't significantly affect life expectancy.

Smaller Innovations

The glamorous future included no digital photography or stereo speakers tiny enough to fit in your ears. No forensic DNA testing or home pregnancy tests. No ubiquitous microwave ovens or video games or bar codes or laser levels or CGI-filled movies. No super absorbent polymers for disposable diapers -- indeed, no disposable diapers of any kind.

Nor was much business innovation evident in those 20th century visions. The glamorous future included no FedEx or Wal- Mart, no Starbucks or Nike or Craigslist -- culturally transformative enterprises that use technology but derive their real value from organization and insight. Nobody used shipping containers or optimized supply chains. The manufacturing revolution that began at Toyota never happened. And forget about such complex but quotidian inventions as wickable fabrics or salad in a bag.

The point isn't that people in the past failed to predict all these innovations. It's that people in the present take them for granted.

Technologists who lament the "end of the future" are denigrating the decentralized, incremental advances that actually improve everyday life. And they're promoting a truncated idea of past innovation: economic history with railroads but no department stores, radio but no ready-to-wear apparel, vaccines but no consumer packaged goods, jets but no plastics.

"Economic change in all periods depends, more than most economists think, on what people believe," observes the economic historian Joel Mokyr. If a few venture capitalists believe that "transformational technologies" are worth betting on, we may see some bold ideas come to fruition. But if they also convince the general public that the only worthwhile technological initiatives are splashy ventures that rate mentions in a State of the Union address, we won't have more technological progress. We'll have less.

(Virginia Postrel is a Bloomberg View columnist. She is the author of "The Future and Its Enemies" and "The Substance of Style," and is writing a book on glamour. Follow her on Twitter. The opinions expressed are her own.)

To contact the writer of this article: Virginia Postrel at vp@dynamist.com.

To contact the editor responsible for this article: Tobin Harshaw at tharshaw@bloomberg.net.


Sent from my iPad

Tuesday, February 5, 2013

Fwd: Marc to Market


Sent from my iPhone

Begin forwarded message:

From: Marc to Market <marc.c.chandler@gmail.com>
Date: February 5, 2013, 5:08:13 AM CST
To: Jerryvillella@yahoo.com
Subject: Marc to Market

Marc to Market

Marc to Market


Great Graphic: Global Gini

Posted: 05 Feb 2013 03:00 AM PST

This Great Graphic is posted in numerous places, but I saw it on Miles Corak's blog Economics for Public Policy.  Alan Kruger, the Chairman of the Economic Advisors of the President helped popularize it in a speech last year.    

It charts the inequality (horizontal axis) against generational income mobility (vertical axis).   Denmark, for example in the lower right hand corner, is the most equal society with the most mobility.  Brazil, is among the most unequal societies with relatively weak mobility.     In a study that included a more countries, Corak actually found South Africa was the most unequal and the least mobile country. 

These two dimensions of (in)equality seem to go hand in hand. While few would find it surprising that the US is the least equal of the major industrialized countries, the relatively weaker inter-generational mobility runs counter to conventional wisdom.  The traditional  source of inter-generational mobility, higher education, is out of reach of an increasing number of Americans without taking on what appears to be debilitating debt.  The social, political and economic consequences of this simple chart of far reaching and arguably ranks up there with demographic shifts as fundamental challenges we face.  

Spain: No Mas

Posted: 04 Feb 2013 03:50 PM PST

The accusations of corruption against senior Popular Party officials, including Spanish Prime Minister Rajoy would not have necessarily been market move.   The accusations raise more questions than they answer.  However, Rajoy's denial may have deterred Asian traders early Monday, but European investors were more skeptical.  

Confidence in the Rajoy government has been eroding as the economy deteriorates.  The fourth quarter contraction was deeper than the Bank of Spain expected.  News on Monday included the largest jump in unemployment since January 2013.   In addition, Spain's three largest banks, Santander, BBVA and CaixaBank announced large write downs in recent days, in part due to large real estate provisions, reminding investors a key source of Spain's vulnerability.

Calls for Rajoy's resignation from opposition forces were given more credence by the financial press than they deserve.  Nevertheless, the political fragility is palatable.  The one thing that could bolster the government's support is not German Chancellor Merkel's best wishes, but an substantial improvement in the Spanish economy.  This does not look to be forthcoming for at least several months.   

The decline in sovereign yields over the past six months has been a powerful tonic.  Spanish financial institutions are large holders of government bonds.  Their access to the capital markets also improved.  This is part of the positive contagion.  

Spanish bonds sold off sharply on Monday.  It seemed to trigger a slide in the euro after new multi-month highs were set before the weekend above $1.37.  The last part of the euro's rally took place even as Spanish yields were rising in absolute terms and relative to Germany.  

The Spanish-German 2-year spread bottomed on Jan 11 near 200 bp.  It finished last month at 230 bp and is now just above 260 bp.  The Spain's 2-year yield bottomed on Jan 10 at about 2.11% and had risen to 2.50% by the end of Jan and was near 2.88% on Monday.   

A similar story is told by the performance of the 10-year bonds.  Spanish 10-year bond yields have been rising and driving the premium over Germany has been rising for a few weeks.   Spain's premium fell to 330 bp on Jan 11 and has been trending higher since.  The premium stood at 355 bp at the end of Jan and 382 bp on Monday.   The Spanish 10-year yield bottomed the same day just below 4.90% and is now at 5.43%

The review of the recent action illustrates that the euro has been able to rally in the face of the increase in Spanish bond yields and widening premium over Germany.    The key question now is whether this phase is over and the risk emanating from the periphery will again be a driver of the foreign exchange market and the capital markets more broadly.    

It is coming too amid increased political fallout of the third bailout of Italy's third largest bank, Monte Dei Paschi.   The center-left PD has suffered the most in the polls three weeks ahead of the election.  Although it is still ahead, the margin over Berlusconi's PDL has narrowed.  Berlusconi, the consummate politician is running circles around this rivals, appealing the basest populist instincts.

As an aggregator of information, the market generates noise and a signal.  We suspect the flare up in political tensions is noise and that the underlying signal generated by the OMT backstop (which is the inducement cited by some of the world's largest money managers for returning to the European debt market) and the more recent passive tightening of monetary conditions in Europe will continue to underpin the euro.  

The latter is taking place at the same time the Federal Reserve renewed its commitment to buying $85 bln a month in long-term assets.  Although US job creation has accelerated, the economy is downshifting.  Over the past four quarters, the economy has posted average annualized growth of 1.6%.  Over the past three year, quarterly average has been 2.0%.  Moreover, the impact of the end of the payroll savings tax holiday and the sequester warns of a couple more quarters of weak growth.

We anticipate that new euro buying will emerge on this pullback. Investors may rightfully be cautious ahead of the ECB meeting.   Sharp sell-offs, like the one seen Monday, are rarely a one-day phenomenon.   Technically, there seems to be scope for euro losses toward $1.34.