Misreading the tea leaves of the broad money supply
 Some economists continue to misinterpret the recent movements in M2, one of the measures of the US broad money supply. People use this indicator to argue all sorts of things - from a slowdown in lending to the reason for low inflation and even as a harbinger of a major correction in equities. While such conclusions could certainly end up being correct, it is unlikely that the movements in M2 have anything to do with it.
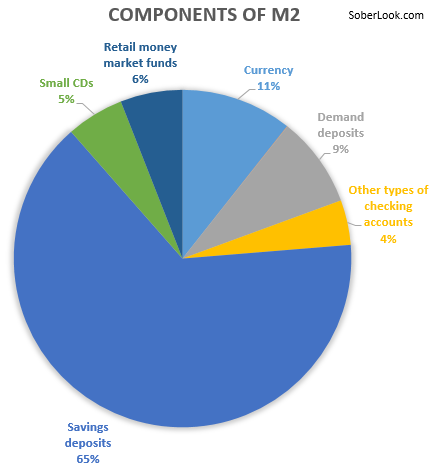
First of all, what exactly is M2? The chart below shows the components (one item not shown is the amount in travelers checks - too small to be displayed on this chart).
 |
| "Small CDs" = under $100K; "Currency" = physical bills |
The money supply is one of those measures that is not supposed to be impacted by asset rotation. For example if you use your cash to buy a car or a stock, someone else will have your cash - so the overall amount of cash in the system has not changed. If people move money from savings to checking, the aggregate once again should stay the same.
In theory this factor would be impacted primarily by banks lending money. For example, Sarah deposits $100 at a bank. Frank borrows $90 from the same bank and deposits it there (maybe temporarily). Now deposits have increased from $100 to $190, which would show up in M2 (and the bank has increased its leverage ratio).
But there are two components of this measure that cloud this logic: Certificates of Deposit (CDs) and Money Market Funds. If funds come out of these two categories and get deployed in say a short-term bond fund or a stock fund for that matter, M2 would decline. That is if Sarah swaps her CD for a mutual fund, (unwinds the CD or lets it mature and uses the proceeds to buy the fund), the cash balance does not change but the CD amount in the system declines. That will result in lower M2.
We know that both money markets funds (see discussion) and CDs (see discussion) have seen material declines recently. People move funds from these two categories into high yielding savings accounts as well as to bond funds and recently stocks (rather than into another CD). The net effect is lower CD amount outstanding and slower than expected growth in M2 - which is unrelated to bank lending.
Looking at how the components of M2 changed over the past 3 months (chart below), we in fact see the declines in these two categories.
From this measure alone we can't tell how much of the declines in CDs and money market funds went into deposits and how much ended up in bond funds or stocks. We do know however that mutual fund inflows have been strong across the board recently.
 |
| Source: ICI |
Whatever the case, lower CD and money market amounts outstanding result in a reduction to M2. Some economists prefer using MZM rather than M2, which excludes CDs but includes institutional money market funds instead. Institutional money funds however have also been declining (as the SEC pushes to implement regulatory changes that will result in these funds fluctuating in value.) Therefore MZM is impacted by this "asset rotation" as well, although potentially at a different rate. Therefore, before reading too much into the movements in broad money supply measures, one should consider the components of these indicators and what the changes in the components really tell us.
SoberLook.comFrom our sponsor:
Why you should look at "Line Item 12" of Michelle Obama's tax returns. Look at the astonishing numbers Michelle is posting to her tax returns.
Sent from my iPhone

No comments:
Post a Comment